Factary launches new and improved New Trust Archive Database

For the past two years we have been working hard to develop and improve our New Trust Update Archive Database to fully make use of the ever-accumulating data we hold on newly-created UK grant-makers. The database contains information on nearly 4,000 active trusts that have been featured in our monthly New Trust Update reports since 2005, the majority of which do not appear on any other leading directory.

What’s new and what’s improved

In March 2025 we launched the new and improved Archive Database, which is available to New Trust Update subscribers alongside the monthly reports on newly registered trusts. The main changes and improvements from the previous version of the online archive database are:

Accurate and up-to-date data

We have reviewed all the active trusts on the database and gathered accurate classification information on their areas of activity and geographic area of benefit, reflecting who, what and where tend to get the trusts’ support. This is based on their stated interests, activities, accounts, website and grant-making.

Detailed activities classification system

We have expanded the activities classification system from 11 categories to 28, allowing for far more targeted searches.

Granular geographic area of benefit system

The detailed geographic classification system, going down to the regional level in the UK and continental region level internationally, allows you to find funders for causes or projects in specific UK and international regions.

Regular updated data from the Charity Commission

Contact details, trustees and financial information for each trust are regularly updated from the Charity Commission.

Grant history

Where available, we have gathered details of the grants awarded by the trusts and foundations. As well as displaying these grants in the trust’s profile, we have used this information to allow searches on grant capacity as well as direct searches for competitor funders.

Additional flags and classifications

When reviewing each trust, we add flags to indicate whether a trust is a corporate foundation, if they explicitly do not accept unsolicited applications and whether they are a ‘Foundation of Wealth’ – established by a philanthropist whose wealth is estimated to be in excess of £10m.

Constant additions and maintenance

Newly registered trusts are reviewed after three years, with their Activity and Geography classifications updated. New grant data is constantly added, helping to build up a picture of the trusts’ interests and activities over time.

What’s in the database?

As of March 2025, there are 3,498 trusts and foundations on the database. We have analysed the data to gain an insight into noticeable trends or interesting statistics regarding the UK grant-maker landscape.

A full overview is available below, but the key highlights are:

Activity type

We have expanded the range of activity type categories from 11 to 28.

In some cases we have split out existing categories such as Arts, Culture, Sport & Recreation becoming Arts & Culture and Sports & Recreation or Religious Activities becoming Christianity, Judaism, Islam and Other Religions.

We have also created new categories such as Mental Health, Hospices, Higher Education, Research and Armed Forces to reflect the funding priorities of our subscribers.

This gives users the ability to be far more targeted in their searches, and fewer irrelevant trusts being returned.

As we have seen when we have analysed the database before, the most common activity type is General Charitable Purposes.

Many trusts are registered with General Charitable Purposes when they are first established meaning, in theory, they are willing to consider any type of charitable activity. However, as part of our review process we look at the grant-makers’ actual activities and interests, including their grant-making patterns, so over time we are able to classify these trusts more accurately.

After General Charitable Purposes, the best supported areas of philanthropic activity based on the number of grant-makers are Welfare (broadly helping those who are disadvantaged), Education & Training and Health.

Geography

Overall, there are 2,941 trusts that state they will support organisations and causes across the UK, and 2,101 that will support work overseas. 769 trusts report or show a regional preference within the UK. Our granular geographic area of benefit classification system allows users to find local funders for their projects across the UK or in specific regions around the world.

Income

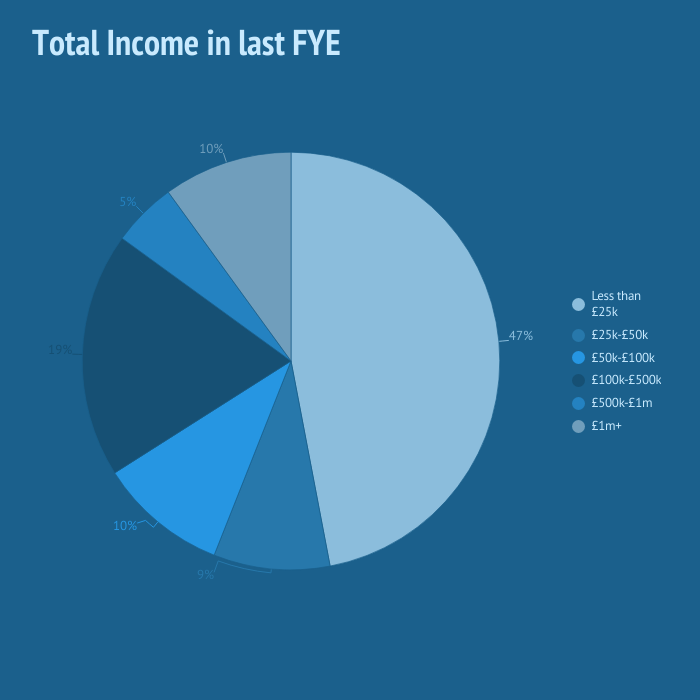
The largest proportion of grant-makers in the UK remain small, with an income of under £25,000. However, over one in three of the grant-makers registered in England and Wales, and featured in the New Trust Update archive database, end up having an income of over £100,000, and one in ten have an income of over £1m. Past research has shown that many of these reach this level of income and expenditure within the first few years of operation.

Grants

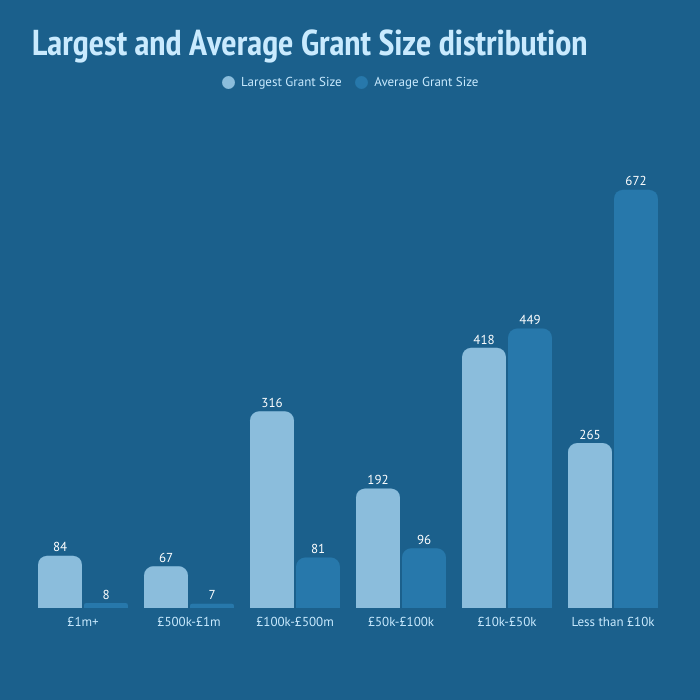
Where available, we have gathered recent grant-making histories for the funders in the Archive database. This allows us to see a funder’s grant capacity (largest grants awarded) as well as calculate an average grant amount.

This shows that overall 80 per cent (over 1,000) that report on grants have a demonstrated capacity to give grants of £10,000 or more and over a third have the capacity to make six-figure grants.

However, when we look at the average grant amount for each funder, we see that half of them are most likely to award small grants of under £10,000. This is in keeping with the total income figures above, and backing up the fact that the majority of grant-makers in the UK are small, with only a minority growing to be able to offer large grants.

We will be analysing the data contained in the Archive Database in more detail in the coming months and sharing further trends and insights from the UK grant-making sector.

If you would like to learn more about Factary’s New Trust Update service and get an online demonstration of our new and improved Archive Database please contact Will Whitefield at will@factary.com.

Why 18?

Why do we say that strategic donor (‘major donor’) programmes take eighteen months to break even? It’s a number I have heard again and again, and that I repeat when I am teaching strategy at the Postgraduate in fundraising at the University of Barcelona, without having hard data to back up the claim.

To find an answer, I have been experimenting on myself. Since January 2017 I have been working a few days a week with Pallapupas, the healthcare clown organisation in Catalonia. I’m their strategic donor fundraiser. I thought, with the arrogance of years of experience as a consultant and researcher, that – ha! – this was going to be easy. In six months, I thought, we’ll fix this and I can sit back and watch the money roll in.

And here we are, almost eighteen months later and now, after a lot of blood, sweat and tears, now we can see the money starting to roll in.

So why? Why does it take eighteen months to get to the tipping point in a strategic donor programme? I have worked with many different programmes across Europe, but there are common threads in all of them:

You, and Me

Fundraising shines a bright light on your own character. So I have learned, in the last 18 months, that I am no blooming good at cold calling by phone (OK, I am doing it in my second language, but that’s no excuse); that I really enjoy building networks of people and sometimes focus more on that than on the money; and that I develop relationships with people over time, not at speed. All of these factors help explain why it takes me time to reach breakeven.

But this is not some embarrassing confessional. I’m illustrating the point that each of us who takes on a strategic fundraising role brings our character to play – and that affects how long it takes to reach the moment when the programme is up and running.

The Case

Many European NGOs are starting strategic donor programmes after years of running mass-marketing, mail- and email-driven, fundraising programmes. They have had years, therefore, of making offers to donors like ‘with €10 a month you can save a life.’

So the first challenge for the new strategic donor fundraiser is how to build a case for €10,000, or €100,000, or €10m. That is an enormous leap for many organisations. Some of them back out, building middle donor programmes with asks in the hundreds, not the thousands of Euros.

Making the case means putting together a budget, making a business plan, winning buy-in from colleagues and key staff, and producing a convincing elevator pitch. All of which takes time…and more, if you hit problems with the Project Pipeline, or the words.

The Project Pipeline

Does the organisation have €100,000 projects? Or €10m projects? Or dreams at these levels of funding? For many organisations this is a challenge. The project pipeline does not exist – there is no ‘deal flow’ in investment terms – so there is nothing for the fundraiser to propose to her prospects. Sometimes, in large, complex organisations, you can see the projects but they are distant and hazy, and there are 30 layers of stakeholders between you, the fundraiser, and the project. You know it is going to take an age to cut through the jungle.

Even when you can see the projects, you need permission to use them. In some organisations this can take a long time. In others, it’s a race to own a project before another colleague grabs it to pitch to her favourite donor.

The Words

When you join an organisation as a new fundraiser, you have to learn that organisation’s language. Some of this is technical language – of the type you would use in a medical research organisation for example – and some of it is an adaptation to the language of your end-users or beneficiaries, as happens when you shift from talking about ‘people with disabilities’ to ‘people with different abilities.’

Your choice of words is sensitive, and more so when you are working with strategic donors because you will be working alongside the board and the director, both highly tuned to the right words. Eighteen months in, and I am still learning how to paraphrase the mix of culture, theatre, humour and hospitalised kids that typifies clowns in healthcare.

The Data

Too many organisations in Europe have too little data. We know so little about our donors. Yes, data protection and privacy are key issues, but your local supermarket knows more about you, your interests, your attitudes and your wealth than the biggest organisation that you donate to. Many organisations don’t know what jobs their donors do, what age they are, or anything about their family situation. Without this data we are working in the dark.

Compare this to the private banks, who are increasingly entering the HNWI and UHNWI area to offer philanthropic services. I spoke with the head of philanthropy at a leading private bank (50,000 clients, 500 account managers) a few weeks ago; he told me that because he can see the banking account details of his clients he knows exactly which charities they are giving to, and can work out which causes the client is interested in. He can offer philanthropic services (including channelling money via the bank’s own foundation) precisely tailored to that client’s needs.

Because they have too little data, many organisations have to focus on the tiny handful of prospects whom they know directly, via personal contacts. So instead of broadening their strategic donor programme to reach the hundreds of existing donors who have the money, they rely on the tiny inner circle.

That means lower productivity, a limited focus, and slow programme growth – because growth is organic, person-to-person.

Systems

Our systems don’t just slow us up, they can clog us up. A simple system problem – when, for example, the donor database does not talk to the accounts system, or where the two use a slightly different coding system – can mean that we have to manually re-enter data. Or it can mean that searches for a donor’s history are a headache.

Sometimes it is the thank-you system. I have worked with organisations that have an automated process for sending out thank-yous of the ‘Dear Sir/Madam Thank you for your gift of €xxxx [fill in number]…’ type. So Madame LaRiche, who has just sent you half a million, gets a ‘Dear Sir/Madam…’ letter and there is nothing you can do to stop it. It takes time to persuade the I.T. team to change their ways.

These are stupid niggles in the system. But they slow us down. Or more likely, catch us out just when we think we have a programme ready to go.

Leadership

You have produced the case, sharpened your elevator pitch, identified potential donors and built a workplan. But you need the leadership to be engaged if this is going to work. You need their buy-in because you want to work with them and their contacts, but also because you and they are going to have to take some tough decisions (this ALWAYS happens with strategic donor programmes); should we work with that potential donor? What do we do when a prospect offers us a lot of money…to do the project he wants, not the one we want?

“Bring in leadership from the start.” Yes, that is what the textbooks say. But making that happen in real, busy lives where people have a load of other priorities, takes time.

Reporting, and donor stewardship

This is going to happen after you win the new donations and partnerships. But you simply have to get this sorted out before you meet your first prospect. Bench-test the process with your colleagues so that you understand every potential glitch on the way. Your donors and partners want to see the numbers, the stories, the videos and the pictures of ‘their’ project. So if that information is going to be hard to collect because your field office is hard to reach, because you need special permission to use this or that photo, or because the impact report is still being compiled, then either find alternatives, or wait until the material is sorted out.

So that’s why it takes 18 months

Because you need to get all of this moving at the same time, involving players right across your organisation, from the chair of the board to the lab technician or assistant field worker. In amongst all of these threads of action is a critical path, the line you must follow in order to achieve your goal. But when you are new to the organisation, you simply cannot know where that path lies, nor where the potholes are that are going to slow you down. You have to learn, to listen, to find all this out. And that takes time.

Inside, not Outside

None of this is the market, or the culture of philanthropy – the reasons most commonly cited for the time it takes to get a programme to maturity. These are all internal reasons – stuff inside the organisation, combined with your own character traits, that limit your speed of action.

Faster?

Are there shortcuts? Could we be working faster? In hindsight, you can see that there are. But the problem is that you can’t get to the hindsight until you have put time behind you. Getting leadership onside early certainly speeds up the process, in part because it opens doors to stakeholders in technical, financial and communications departments. Quick work with the case – especially, building and testing case documents internally to get buy-in – is also a help. But neither of these routes is going to shave a lot off your timescale.

So I have learned to set expectations, right from the start. To say ‘eighteen months’ in the knowledge that that is how long it will probably take, but also in the hope that the break-through will come sooner.

Chris Carnie is the author of ‘How Philanthropy is Changing in Europe’, published by Policy Press.

Still wondering about major donors?

If you had any doubts about “major donor” fundraising – at Factary we use the term “strategic donor” – then today’s article by Martin Wolf should help dispel them (Wolf, M., 2016. The economic losers are in revolt against the elites. Financial Times).

In the article, Wolf reviews the work of Branko Milanovic, previously Lead Economist at the World Bank’s research department, who showed in a 2013 paper (Milanovic, B., 2013. Global Income Inequality by the Numbers: In History and Now. An Overview. Global Policy (May 2013), pp.198–208.) how personal incomes for the majority of people in Europe and the US have stagnated whilst the incomes of the wealthiest 10% have grown. This we knew from other studies of the wealth gap. But what makes this chart so interesting is that there is another group of people whose incomes have stagnated – the poorest 10% globally.

Change in real income between 1988 and 2008 at various percentiles of global income distribution (calculated in 2005 international dollars)

income distribution global

Notes: This is global income, so the middle class in Europe is in the 70%-80% range. The vertical axis shows the percentage change in real income, measured in constant international dollars. The horizontal axis shows the percentile position in the global income distribution. The percentile positions run from 5 to 95, in increments of five, while the top 5% are divided into two groups: the top 1%, and those between 95th and 99th percentiles.

So here is a demand and a supply argument for strategic donor fundraising. On the demand side (of the non-profit world) the poorest of the poor are staying poor or getting poorer. Non-profits have more to do, must raise more to help more.

On the supply side, the “normal” donors (or “consumer donors”) who provide the bulk of donations to Europe’s non-profits are earning the same as they earned in 1998, or less. Perhaps this is part of the reason why regular fundraising has been struggling for so long; middle income donors (in Europe) have been taking home the same wages for the last ten years, so they are unable to increase their gifts, despite the best efforts of fundraising. As Prof Adrian Sargeant never tires of telling us,

‘In the UK, charitable giving is estimated to be around one per cent of gross domestic product and while there are annual variations, this figure has proved remarkably static over time. Despite the best efforts of governments, philanthropists and a generation of fundraisers, the needle hasn’t moved much on giving since data were first recorded.’

(Sargeant, A. & Shang, J., 2011. Growing Philanthropy in the United Kingdom. A Report on the July 2011 Growing Philanthropy Summit, Bristol, UK: University of the West of England. Available here.)

But up there among the elites the picture is very different. The top ten percent of earners enjoyed real-term income growth over the period 1998-2008 with the top 1% winning increases of 60% on average, world-wide. Yes, the subsequent recession may have taken a little off the top of that, but as the annual European wealth lists show us, wealth has survived the recession in remarkably good shape.

So at both ends of our work as fundraisers there is a case for strategic donors; at the poorest end where we have to do more and more for people with less and less, and at the wealthiest end where we can see a significant segment of the population heading up the income ladder.

Time to chase after your well researched prospect pool…with a strong, well-researched, case statement.

Which leaves me – and many fundraisers – in the ethical soup. I joined fundraising as a means to an end – the end of social inequalities, of poverty, of human suffering. So while I celebrate the growth of the strategic philanthropy market…I disapprove of the system that makes a few rich and leaves the rest poor.

Difficult dilemma.

But there is a lot of potentially philanthropic money out there, and a lot more people who need it; so stop wondering about major donors and get on with it.